Table Designer Help
Training Videos (screencasts)
Please note that the screencasts are not clickable. When the screencast says "Click here...", we mean in practice, not during training.
Help File Index
Table Designer
The NHTS Table Designer allows you to build customized tabulations using only a Web browser. Three surveys are supported: the 2009 NHTS, the 2001 NHTS, and the 1995 NPTS. A basic NHTS tabulation consists of an Analysis Variable and from one to three tabulation variables.
A two-way table is a cross tabulation and a three-way table is a two-way table by page.
Use the Variable Browser to add analysis variables to your customized variable list.
Login
The NHTS Online Tools use your email address to remember your analysis settings from session to session. There is no password or other registration requirements. Note that your email address will not be shared with others.
If you prefer, you can login as a guest.
Create Table: An Introduction
For your first tabulation, default values have been set for the Analysis Variable (Count of Households) and tabulation variable (household income, HHFAMINC). Click the Create Table button to submit the table request. This returns a Job ID. After a minute or so, click on the Output Area button to check on the status of your job. The Output Area contains links to your table in HTML and Excel spreadsheet formats.
Selecting Variables for Analysis
Click  to open the Select Variables page. Variables available for analysis are
presented in a table. Sort the table by clicking on a column header. Also, you
can search for variables by entering a keyword (e.g., 'pur' for Trip Purpose).
Click on the Variable name to select that variable for analysis. Or, use the
checkboxes to select (and deselect) multiple variables followed by the Submit
button.
to open the Select Variables page. Variables available for analysis are
presented in a table. Sort the table by clicking on a column header. Also, you
can search for variables by entering a keyword (e.g., 'pur' for Trip Purpose).
Click on the Variable name to select that variable for analysis. Or, use the
checkboxes to select (and deselect) multiple variables followed by the Submit
button.
How to Create and Use Variable Categories
- What are Variable Categories?
- How do I create and manage Variable Categories?
- What is a Pick List?
- Example #1 - Specifying variable values and working with character variables
- Example #2 - Working with numeric variables (e.g., BESTMILE)
- Example #3 - Overlapping category boundaries
- What happens if I make a mistake?
What are Variable Categories?
Variable Categories provide a way for you to organize response values into groups. A good example is to create a custom definition of 'low income' that consists of the first five response values of HHFAMINC. There are several examples below.
Creating Variable Categories can be hard because there are details to attend to, tricks and traps, and the syntax is different for numeric variables (e.g., BESTMILE) versus character variables (e.g., HHFAMINC).
The Codebook can be very helpful. It shows you the type of variable (numeric or character) and the valid values with their meanings. Note that the book icon next to a variable name provides a link to the online codebook page.
How do I create and manage Variable Categories?
Table Designer provides the controls to create, manage, and apply Variable Categories. Each tabulation variable can have an optional category. Once the category is defined, the checkbox becomes enabled.
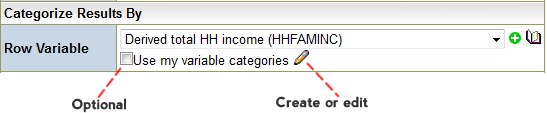
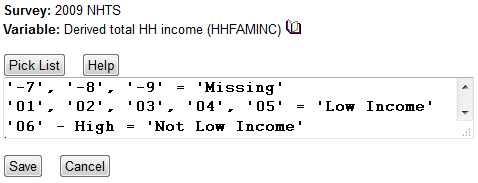
Clicking on the pencil icon opens the Variable Category editor. Below is an example of a Variable Category for HHFAMINC. The user has defined 'low income' to consist of the first five response values and has separated the remaining values into 'missing' or 'not low income'. We see that each line consists of variable value selectors on the left, an equals sign, and a label enclosed in quotes.
What is a Pick List?
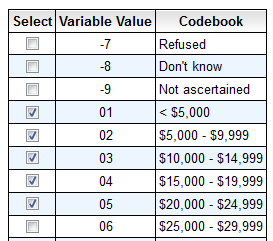
A pick list provides a convenient way to select the variable values that define a category selector. Below is a pick list for HHFAMINC and the user has selected the first five values (excluding missing).
Example #1 - Specifying variable values and working with character variables
As shown in the figure above, the selector values for a character varaible such as HHFAMINC must be enclosed in quotes. A selector can be a single value, a list of values separated by commas, or a range. Therefore the 'low income' selector could also be defined as the range '01' - '05'. There are range keywords: LOW and HIGH. Another keyword is OTHER which can be used to select all response values not already defined by previous selectors.
Example #2 - Working with numeric variables (e.g., BESTMILE)
Below is an example of a Variable Category definition for a numeric variable, BESTMILE. The numeric selectors are numbers, are not enclosed in quotes, and do not contain commas. There is no Pick List; consult the Codebook page to learn about the range of responses.

Example #3 - overlapping category boundaries
In the example above, to minimize typing and to improve readability, the user has specified overlapping category boundaries (i.e., 12000). But, which selector gets the records with a value of 12000? The answer is, the first one. You can also enter category intervals with any required precision (e.g., 0.333333 - 0.666666).
What happens if I make a mistake?
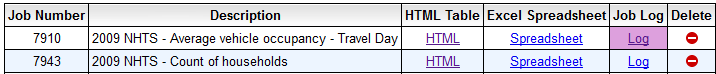
It is easy to make a typing error or to create an invalid Variable Catetory specification. Usually, this will throw an error and the resulting table will be empty. Check the Log file for error messages that may provide a clue to the problem. Also, it is possible to create a table so large, the Web browser cannot render it. In the example below, Job 7910 has an error message in the Log.
Subgroup
The Subgroup option provides a way to focus the tabulation on a specified subset of survey response records. A subgroup statement is very similar to an SQL where clause.
It is possible to create an error due to a illogical or syntactically incorrect Subgroup Statement. The Output Area will display a modified Log file link. Check the log file for hints on how to correct the problem.
The calculation of tabulation standard errors (SE) is an option on Table Designer. For the 2009 survey, the outputs are the margin of error (95% confidence interval).
An overview of the 1995 SE algorithm can be found on the Data Center page as well as links to the SAS source code and full report.
The 2001 and 2009 surveys provide replicate weights that can be used to calculate variance estimates (e.g., SE and CI); see Sections 5 and 7 of the User's Guide for additional information.